MSI applications part 2: peptides and proteins
In this blog post we go back to the roots of mass spectrometry imaging, and describe it’s first breakthrough application on biological samples: analyzing the spatial distribution of proteins and peptides in tissue.
This post is part of our series titled "Introduction to mass spectrometry imaging", which contains the following entries:
- MSI hardware part 1: ionization techniques
- MSI hardware part 2: mass analyzers
- MSI applications part 1: glycans
- MSI applications part 2: peptides and proteins (current post)
- MSI applications part 3: lipids
- MSI applications part 4: drugs and small molecule metabolites
Table of contents
Introduction
The next subject in our applications blog series is the mass spectrometry imaging of proteins and peptides. For this topic, we need to go back in time to the year 1997. Bill Clinton has been sworn in for his second term as President of the United States, Ginger Spice wore that Union Jack dress to the BRIT awards, and Princess Diana tragically passed away in a Paris hospital. More relevant to our story, 18 days after the birth of Jeon Jungkook in Korea, a field of research was born as Richard Caprioli has a manuscript accepted for publication by the American Chemical Society.1

The birth of Mass Spectrometry Imaging as we know it
Okay, maybe that’s a bit dramatic since SIMS imaging had existed for a few decades before Caprioli, Farmer & Gile, Analytical Chemistry, 1997, 69 (23) 4751 was published, but the field of MSI as we currently know it, dominated by the investigation of biological samples, would arguably not exist without this seminal paper. While MALDI-MS had been used to detect proteins and peptides from biological samples, they had typically been homogenized, mixed with the matrix, and spotted onto a conductive surface.
Caprioli et al. demonstrated that it was possible to map more than one molecule from a tissue section mounted on a conductive metal plate or a blotted imprint of a section using a 2D raster. This allowed the creation of ion images of the sample which could show either the distribution of individual m/z values or summed ion images in the tissue. Importantly, they could detect insulin, which is specifically contained in beta cell islets of the pancreas, and showed the distribution of a proline-rich protein fragment IB-1 from human cheek cells. This led to studies investigating the distribution of proteins in tissue such as mouse colon and brain2,3, and eventually into animal models of disease and human pathology samples.
Sample preparation for protein analysis
While there are some DESI and nanoDESI studies4,5,6, the vast majority has been conducted using MALDI. A typical MALDI-MSI measurement for intact proteins uses fresh-frozen tissue which has been snap-frozen in liquid nitrogen to prevent protein degradation. The frozen tissue is sectioned (10-20 µm thick) in a cryo-microtome, and mounted onto a conductive slide or metal target plate before being washed in graded alcohol and/or other solvents to remove lipids and salts from the tissue that can decrease signal quality.7 It is also possible to measure intact proteins from alcohol-fixed tissues that have been embedded in paraffin which makes the tissue much easier to handle and store.8,9,10 These tissues have the benefit of being cut using a standard paraffin microtome but the sections need extra deparaffinization steps before alcohol washing. Sinapinic acid is typically used as a matrix for proteins (m/z 3000+), however alpha-cyano-4-hydroxycinnamic acid (aka CHCA or HCCA) is commonly used for smaller proteins/larger peptides (m/z 1000-3000).
It must be said that measuring intact proteins regardless of the sample type provides several technical challenges for both the sample preparation and the instrumentation. Firstly, both freezing and alcohol fixation are not typically used to preserve tissue samples, even within research environments, which limits the ability to use archived samples. Additionally, while intact proteins can be measured by MALDI-TOF, the limit of detection required can be quite high, especially for larger proteins, meaning it may need to be found in very high concentrations in the sample. Both of these limitations can be overcome by using on-tissue tryptic digests. As such, studies of intact proteins are less frequently done compared to previous years with peptide digests being far more popular at the moment.

Peptide digests were first reported on fresh-frozen tissues11, followed by formalin-fixed paraffin embedded (FFPE) tissues12, and then FFPE human pathology tissue microarray samples.13
A full protocol for on-tissue tryptic digests was published in 201114, and a number of different groups have published their methods since then15,16,17,18, all following the same general procedure, which has many similar steps to immunohistochemistry and MALDI-MSI analysis of glycans, as outlined below:
- Deparaffinization and rehydration Paraffin is removed from the sections by washing in xylenes then rehydrated in various alcohol solutions. Some protocols include a prior annealing step in which the sections are kept in an incubator at 60-85°C (the melting point of histology-grade paraffin wax is approximately 60°C).14,15,18
- Heat-induced antigen retrieval This step breaks aldehyde cross-links between proteins in the sample. It has been shown that few signals are recorded when antigen retrieval of FFPE is omitted.17
- Trypsin application and digestion Older protocols tend to apply trypsin with an acoustic spotter, newer protocols use spraying robots. The samples are digested in a humid chamber at 37-50°C with durations ranging from a few hours to overnight.
- Matrix application Both alpha-cyano-4-hydroxycinnamic acid (HCCA or CHCA) and 2,5-dihydroxybenzoic acid (DHB) are suitable but HCCA is preferred as it forms small regular crystals which limits spatial delocalization.
- Measurement MALDI-MSI is conducted in positive mode with the peptides typically being [M+H].
- Data analysis This is currently similar to glycan analysis with post-measurement histological/immunohistochemical staining and co-registration to link tissue regions with protein/peptide signatures. This then allows researchers to conduct both targeted (e.g. diagnostic) and exploratory analyses (e.g. clustering of spectra within a region to examine protein heterogeneity), as explained in the following section.
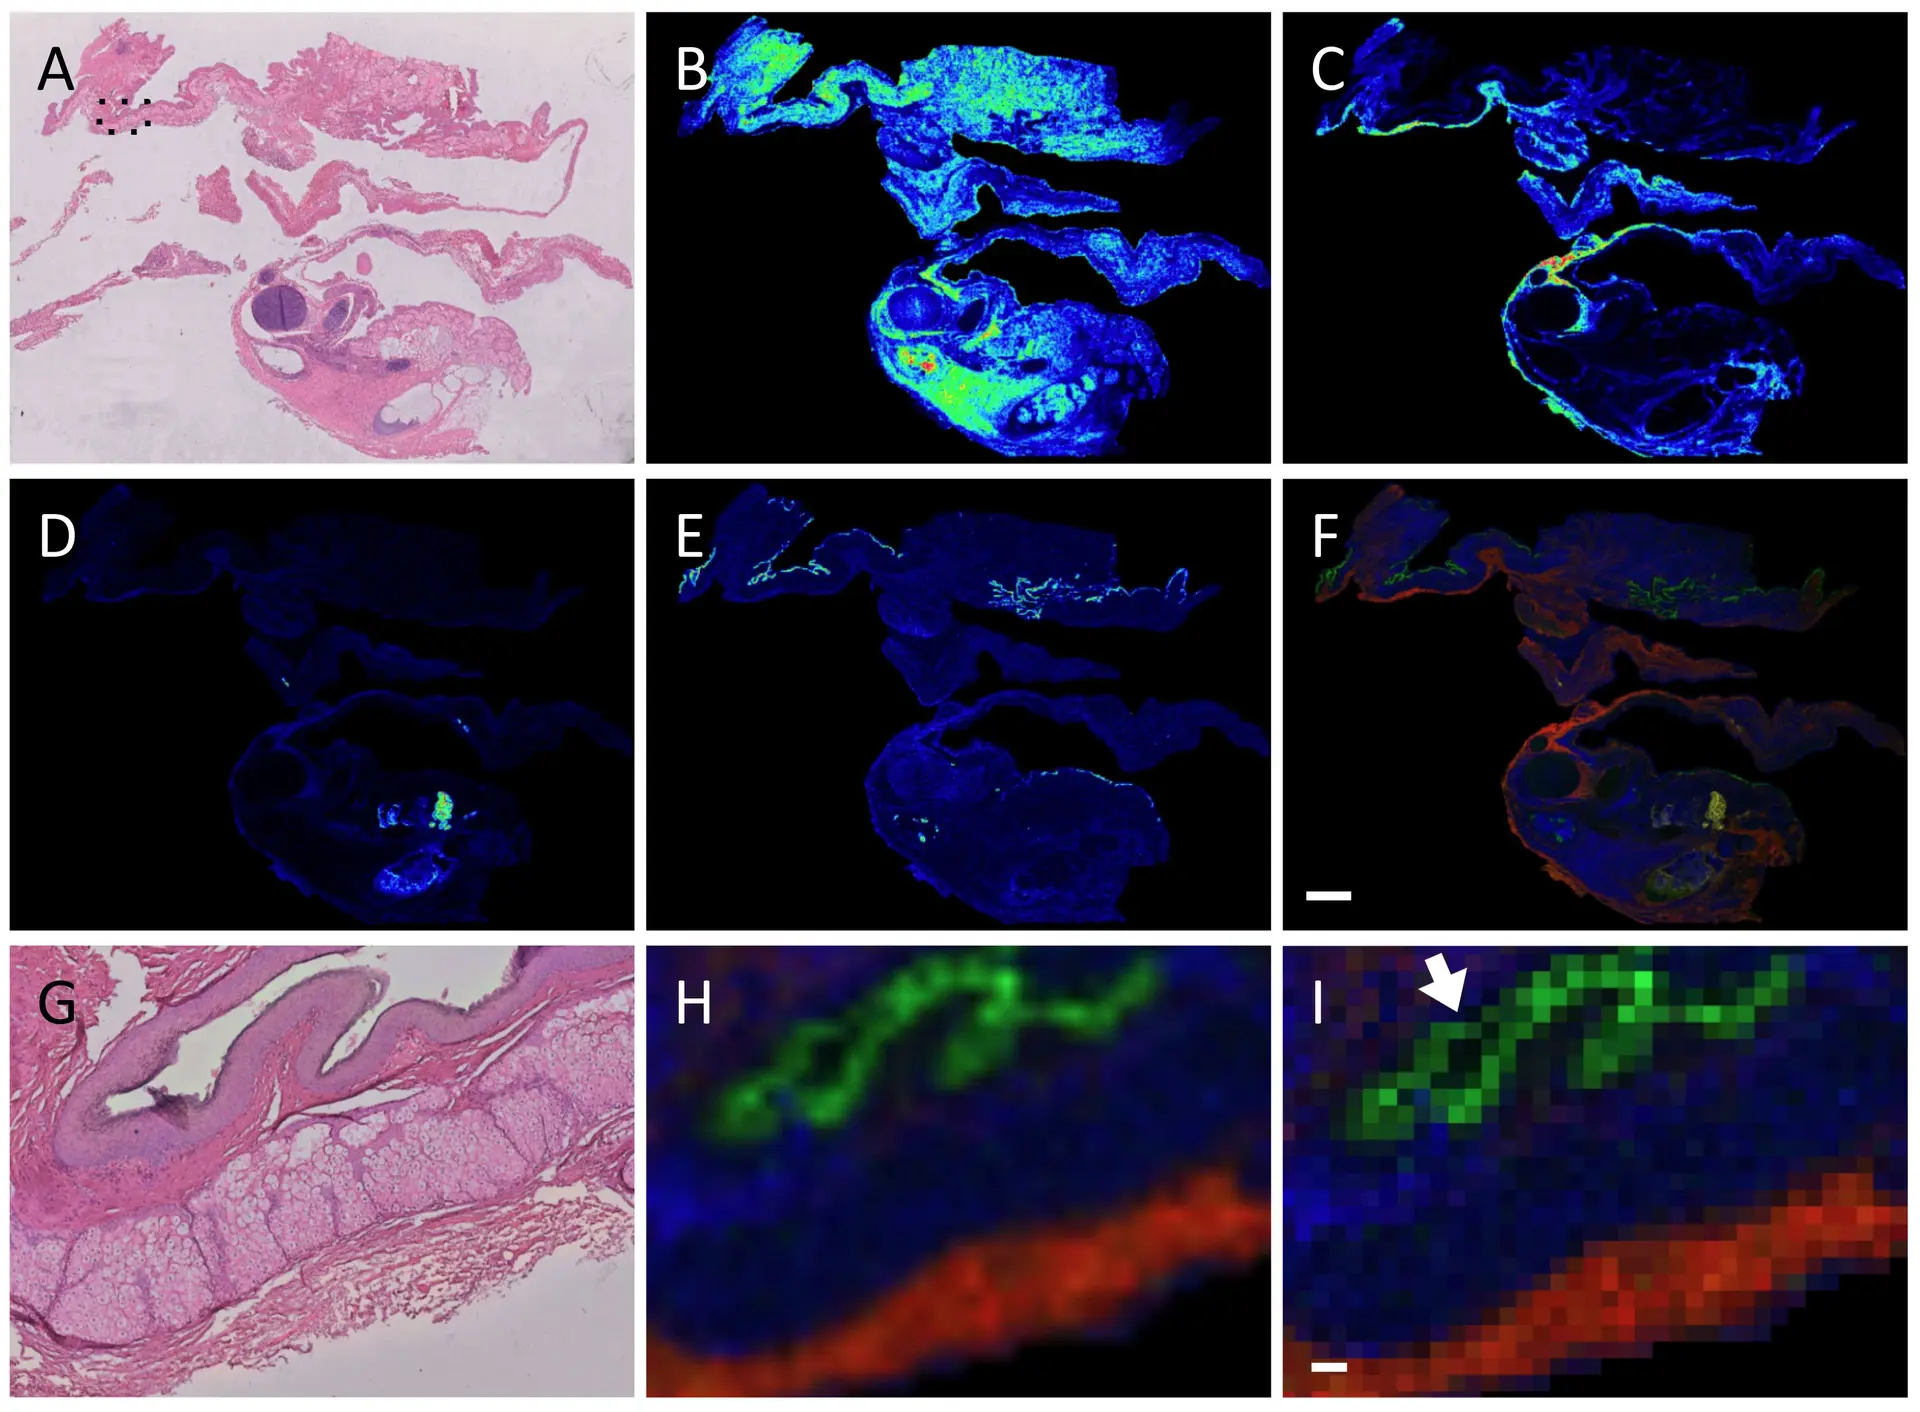
As an example, Figure 1 shows MALDI-MSI images of a human pathology ovarian teratoma section prepared and measured using a FFPE on-tissue tryptic digest protocol, with the measured section stained hematoxylin and eosin and coregistered to the MALDI data (panel A).18 A pathologist independently assessed the stained sample and indicated that the different m/z values seen in panels B-E corresponded to different tissues found within the teratoma, as seen in a merged image (panel F). This is even more clear when viewed at higher magnification (panels G-H), while the ion image as a pixel view shows some ion signals are limited to a 50 µm area (panel I, arrow).
The varied uses of protein/peptide MSI data
Unlike the glycans of our last post, the spatial distribution of proteins can be investigated quite easily with immunohistochemistry or immunofluorescent labelling as many different antibodies are commercially available with well-established protocols. However, both of these methods are limited due to the number of probes that can be used per experiment as well as the need for prior knowledge of the antigens/antibodies being investigated.
Conversely, MSI allows for wide, untargeted screening of the protein and peptide content of a single tissue section, yielding multiplexed data of thousands to millions of peptide-related signals in a single analysis. This wealth of biochemical information provides a much deeper characterization of the peptide/protein content of a sample than can be done using antibodies, however, the complex resulting data generally requires computational analysis to extract the relevant signals. The lack of specific targeting and multiplexed data from a single tissue section means protein/peptide MSI datasets (and MSI datasets in general) can be mined in ways that can’t be done when using antibodies.
While there are far too many studies to get into the nitty-gritty of it, protein/peptide studies tend to use their data in three different but often overlapping ways, particularly when it comes to pathology and more specifically cancer.19
Tissue identification/diagnostics
This originally started as simply determining normal tissues from disease, eventually moving to more complex and clinically relevant questions. These studies typically center around making accurate diagnoses either between benign and malignant conditions or subtyping cancers, particularly when they are difficult to do with more routine methods or if samples are limited. Examples of this include skin20,21,22 thyroid23, renal24, and lung cancer.25,26
In a recent joint publication together with Frontier Diagnostics, the full development and validation of a proteomics-based assay to distinguish melanoma from healthy tissue is described,22 and illustrated in Figure 2 below. This joint work has led to a new state-of-the-art method for melanoma identification.
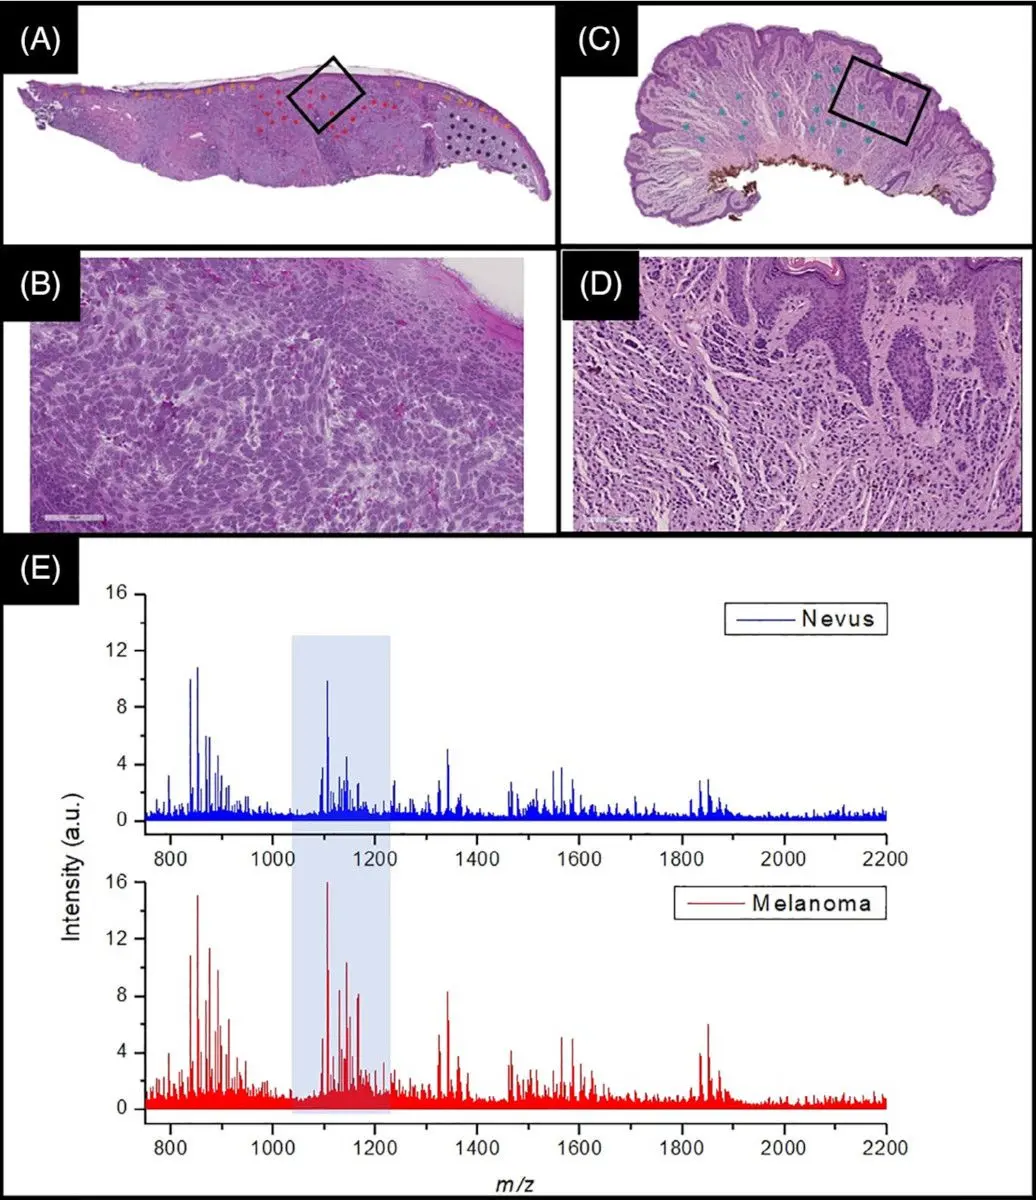
In this collaboration, Aspect Analytics developed the full data analysis pipeline, ranging from a web portal which allows pathologists to annotate regions of interest on H&E whole-slide images, up to training and validating machine learning classifiers based on the mass spectra acquired at the aforementioned regions of interest.
Predicting prognosis
For archived patient samples, protein MSI data can be correlated with clinical outcomes, making it possible to identify individual proteins and/or protein signatures that are markers of events such as metastasis or survival 27,28. MSI has also been used to investigate heterogeneity within tumor populations 29,30, which can provide insights into patient survival and tumor response to therapy.
Understanding clinical response to therapy
Proteomic MSI studies have been used to explain why some patients respond to chemotherapy and others do not. For example, a combination of MALDI-MSI and LC-MS/MS found that oesophageal cancer patients who had pre-existing defects in mitochondrial protein COX7A2 would respond to treatment while tumors in patients without the defect were resistant to the same therapy.31 Such studies could provide information that would help doctors define treatments for patients.
Investigating enzyme activity in-situ – proteomics of the future?
All of the above listed studies looked at measuring proteins or tryptic peptides directly in tissue. In the past few years, a few studies have been published using MALDI-MSI for mapping enzymes, not by looking for the protein directly, but by applying relevant substrates to the tissue and measuring products of the enzyme’s activity.32,33,34. This reduces the technical challenges, such as detecting the intact protein, while using known enzyme substrates should result in known products which should then be found in the resultant spectra if the enzyme is present and active. MALDI-MSI of enzyme products is potentially very promising because, while enzyme activity can be measured with fluorescent dyes, it is not possible for some enzyme classes and simultaneous analysis of multiple enzymes is limited due to spectral overlap. On a biological level, the ability to map and measure enzymes and their activity in tissue sections is extremely useful due to their fundamental role in biological processes and involvement in many different diseases.
Conclusion
In this post, we discussed protein and tryptic peptide mass spectrometry imaging, with a bit of a dive into the history, how mass spectrometry imaging of proteins and peptides are conducted, and gave examples of different clinically-relevant studies using MALDI-MSI of proteins and peptides. If this has piqued your interest for investigating proteins and/or peptides with mass spectrometry imaging, feel free to contact Aspect Analytics for data analysis options.
References:
- Caprioli RM, Farmer TB, Gile J. Molecular imaging of biological samples: localization of peptides and proteins using MALDI-TOF MS. Anal Chem 1997;69:4751-60.
- Chaurand P, Stoeckli M, Caprioli RM. Direct profiling of proteins in biological tissue sections by MALDI mass spectrometry. Anal Chem 1999;71:5263-70.
- Stoeckli M, Chaurand P, Hallahan DE, Caprioli RM. Imaging mass spectrometry: a new technology for the analysis of protein expression in mammalian tissues. Nat Med 2001;7:493-6.
- Garza KY, Feider CL, Klein DR, et al. Desorption Electrospray Ionization Mass Spectrometry Imaging of Proteins Directly from Biological Tissue Sections. Anal Chem 2018;90:7785-9.
- Towers MW, Karancsi T, Jones EA, Pringle SD, Claude E. Optimised Desorption Electrospray Ionisation Mass Spectrometry Imaging (DESI-MSI) for the Analysis of Proteins/Peptides Directly from Tissue Sections on a Travelling Wave Ion Mobility Q-ToF. J Am Soc Mass Spectrom 2018;29:2456-66.
- Hale OJ, Cooper HJ. Native Mass Spectrometry Imaging of Proteins and Protein Complexes by Nano-DESI. Anal Chem 2021;93:4619-27.
- Seeley EH, Oppenheimer SR, Mi D, Chaurand P, Caprioli RM. Enhancement of protein sensitivity for MALDI imaging mass spectrometry after chemical treatment of tissue sections. J Am Soc Mass Spectrom 2008;19:1069-77.
- Chaurand P, Latham JC, Lane KB, et al. Imaging mass spectrometry of intact proteins from alcohol-preserved tissue specimens: bypassing formalin fixation. J Proteome Res 2008;7:3543-55.
- Ergin B, Meding S, Langer R, et al. Proteomic analysis of PAXgene-fixed tissues. J Proteome Res 2010;9:5188-96.
- Urban C, Buck A, Siveke JT, et al. PAXgene fixation enables comprehensive metabolomic and proteomic analyses of tissue specimens by MALDI MSI. Biochim Biophys Acta Gen Subj 2018;1862:51-60.
- Groseclose MR, Andersson M, Hardesty WM, Caprioli RM. Identification of proteins directly from tissue: in situ tryptic digestions coupled with imaging mass spectrometry. J Mass Spectrom 2007;42:254-62.
- Stauber J, Lemaire R, Franck J, et al. MALDI imaging of formalin-fixed paraffin-embedded tissues: application to model animals of Parkinson disease for biomarker hunting. J Proteome Res 2008;7:969-78.
- Groseclose MR, Massion PP, Chaurand P, Caprioli RM. High-throughput proteomic analysis of formalin-fixed paraffin-embedded tissue microarrays using MALDI imaging mass spectrometry. Proteomics 2008;8:3715-24.
- Casadonte R, Caprioli RM. Proteomic analysis of formalin-fixed paraffin-embedded tissue by MALDI imaging mass spectrometry. Nat Protoc 2011;6:1695-709.
- Beine B, Diehl HC, Meyer HE, Henkel C. Tissue MALDI Mass Spectrometry Imaging (MALDI MSI) of Peptides. Methods Mol Biol 2016;1394:129-50.
- De Sio G, Smith AJ, Galli M, et al. A MALDI-Mass Spectrometry Imaging method applicable to different formalin-fixed paraffin-embedded human tissues. Mol Biosyst 2015;11:1507-14.
- Judd AM, Gutierrez DB, Moore JL, et al. A recommended and verified procedure for in situ tryptic digestion of formalin-fixed paraffin-embedded tissues for analysis by matrix-assisted laser desorption/ionization imaging mass spectrometry. J Mass Spectrom 2019;54:716-27.
- Ly A, Longuespee R, Casadonte R, et al. Site-to-Site Reproducibility and Spatial Resolution in MALDI-MSI of Peptides from Formalin-Fixed Paraffin-Embedded Samples. Proteomics Clin Appl 2019;13:e1800029.
- Schwamborn K, Caprioli RM. Molecular imaging by mass spectrometry–looking beyond classical histology. Nat Rev Cancer 2010;10:639-46.
- Lazova R, Seeley EH, Keenan M, Gueorguieva R, Caprioli RM. Imaging mass spectrometry–a new and promising method to differentiate Spitz nevi from Spitzoid malignant melanomas. Am J Dermatopathol 2012;34:82-90.
- Lazova R, Smoot K, Anderson H, et al. Histopathology-guided mass spectrometry differentiates benign nevi from malignant melanoma. J Cutan Pathol 2020;47:226-40.
- Al-Rohil RN, Moore JL, Patterson NH, et al. Diagnosis of melanoma by imaging mass spectrometry: Development and validation of a melanoma prediction model. J Cutan Pathol 2021.
- Pagni F, De Sio G, Garancini M, et al. Proteomics in thyroid cytopathology: Relevance of MALDI-imaging in distinguishing malignant from benign lesions. Proteomics 2016;16:1775-84.
- Kriegsmann M, Casadonte R, Maurer N, et al. Mass Spectrometry Imaging Differentiates Chromophobe Renal Cell Carcinoma and Renal Oncocytoma with High Accuracy. J Cancer 2020;11:6081-9.
- Kriegsmann M, Casadonte R, Kriegsmann J, et al. Reliable Entity Subtyping in Non-small Cell Lung Cancer by Matrix-assisted Laser Desorption/Ionization Imaging Mass Spectrometry on Formalin-fixed Paraffin-embedded Tissue Specimens. Mol Cell Proteomics 2016;15:3081-9.
- Kriegsmann M, Zgorzelski C, Casadonte R, et al. Mass Spectrometry Imaging for Reliable and Fast Classification of Non-Small Cell Lung Cancer Subtypes. Cancers (Basel) 2020;12.
- Balluff B, Rauser S, Meding S, et al. MALDI imaging identifies prognostic seven-protein signature of novel tissue markers in intestinal-type gastric cancer. Am J Pathol 2011;179:2720-9.
- Yanagisawa K, Shyr Y, Xu BJ, et al. Proteomic patterns of tumour subsets in non-small-cell lung cancer. Lancet 2003;362:433-9.
- Balluff B, Frese CK, Maier SK, et al. De novo discovery of phenotypic intratumour heterogeneity using imaging mass spectrometry. J Pathol 2015;235:3-13.
- Wu Z, Hundsdoerfer P, Schulte JH, et al. Discovery of Spatial Peptide Signatures for Neuroblastoma Risk Assessment by MALDI Mass Spectrometry Imaging. Cancers (Basel) 2021;13.
- Aichler M, Elsner M, Ludyga N, et al. Clinical response to chemotherapy in oesophageal adenocarcinoma patients is linked to defects in mitochondria. J Pathol 2013;230:410-9.
- Erich K, Reinle K, Muller T, et al. Spatial Distribution of Endogenous Tissue Protease Activity in Gastric Carcinoma Mapped by MALDI Mass Spectrometry Imaging. Mol Cell Proteomics 2019;18:151-61.
- Hamilton BR, Marshall DL, Casewell NR, et al. Mapping Enzyme Activity on Tissue by Functional Mass Spectrometry Imaging. Angew Chem Int Ed Engl 2020;59:3855-8.
- Klein O, Haeckel A, Reimer U, Nebrich G, Schellenberger E. Multiplex enzyme activity imaging by MALDI-IMS of substrate library conversions. Sci Rep 2020;10:15522.