

Introduction to mass spectrometry data analysis
Mass spectrometry (MS) is an analytical technology that measures the mass-to-charge ratio (m/z) of one or more molecules present within a sample and determines their relative abundance. In this introductory post, we will briefly discuss how mass spectrometry works and point out some intricacies of MS data.
Access publication

This post is part of our series titled "Mass spectrometry data introduction", which contains the following entries:
- Introduction to mass spectrometry data analysis (current post)
Table of contents
- Anatomy of a mass spectrometer
- Output of MS experiments: the glorious mass spectrum
- Challenges in analyzing MS data
- Conclusion
Anatomy of a mass spectrometer
A mass spectrometer involves at least three components:
- An ionization source, which is responsible for generating gas-phase ions from the sample. These ions can then be manipulated using electric and/or magnetic fields. Generating ions can be done in many ways, for instance using laser desorption (LDI) or electrospray (ESI).
- A mass analyzer, which sorts and separates the ions generated in the source based on their m/z values. A straightforward approach is using so-called time-of-flight, which consists of a linear path ions must travel under a constant electrical field. When two ions have the same charge, the ion with the higher mass will take longer to close the distance.
- An ion detector which measures the relative abundance of ions separated by the mass analyzer, stratified over the different mass-to-charge ratios (m/z values).
Many approaches exist for all of the aforementioned steps, with several additional steps that can be added when necessary which we will not discuss here.
The performance of a mass spectrometer is commonly described in terms of its mass resolution, which measures the ability to distinguish peaks of slightly different m/z values in a mass spectrum (Δ𝑀). A higher resolution indicates better separation of peaks. Mass resolution is sometimes expressed in terms of resolving power, which is defined as 𝑀/Δ𝑀 and commonly described in parts per million (ppm) or parts per billion (ppb).
Output of MS experiments: the glorious mass spectrum
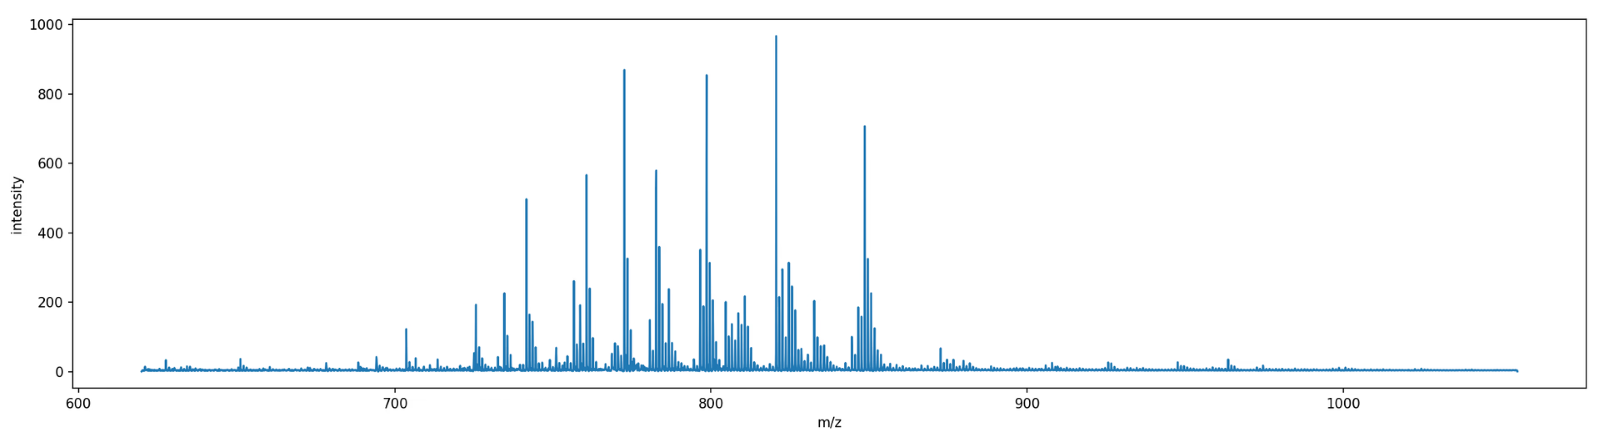
Once our trusty mass spectrometer has finished generating, sorting and counting ions, a mass spectrum is generated based on our sample. A mass spectrum is essentially a histogram spanning the m/z values that were measured. The intensity of a peak at a given m/z value indicates the relative frequency of detected ions with that specific m/z value within the sample.
Within mass spec, mass is usually expressed in Dalton (Da) also known as the unified atomic mass unit. 1 Da is defined as 1/12 of the mass of an unbound neutral 12C atom in its nuclear and electronic ground state and at rest. If you want to show off your massive knowledge at dinner parties, you can mention that you weigh w × 6.022 × 1026 Da where w is your weight in kg.
Challenges in analyzing MS data
In this section we will briefly discuss some key complexities inherent to MS data, which naturally also apply to MSI data. This is by no means an exhaustive list of all complexities within MS data analysis, though it should provide a good first understanding of some of its subtleties, which also translate to MS imaging.
Mass calibration
A first challenge in dealing with MS data is taking care of the mass calibration. Similar to how a regular weight scale is calibrated by putting a known mass on the scale, a mass spectrometer is usually locked onto a molecule with a known m/z as the reference. All the other m/z’s are in essense recorded in reference to that known m/z, similar to the weight scale. Nevertheless, no measurement is perfect, and small variations can lead to shifts in the mass-to-charge ratio, leading to small deviations which become more problematic at high mass resolution.
These inconsistencies between m/z values must be accounted for when performing a joint analysis of multiple spectra. Usually, spectra are mapped onto a common set of m/z bins in a process called realignment or recalibration prior to joint analysis.
Interpreting spectra
Second, it is important to know that there is usually no direct way to unambiguously link a single peak (i.e., 1 m/z value) to a specific biomolecular ion, and vice versa. If you are not familiar with mass spectrometry this may sound counterintuitive. The reason for this is twofold:
- One peak could indicate several biomolecular ions, for several reasons:
- Isomers are organic compounds with the same molecular formula (= same mass) but different structures, and may have completely different chemical properties. A common example are cis and trans fatty acids.
- Distinct molecules may be closer to each other in mass-to-charge ratio than the mass spectrometer can distinguish, i.e., slightly different m/z values ending up in the same bin. This occurs more frequently in low mass resolution instruments.
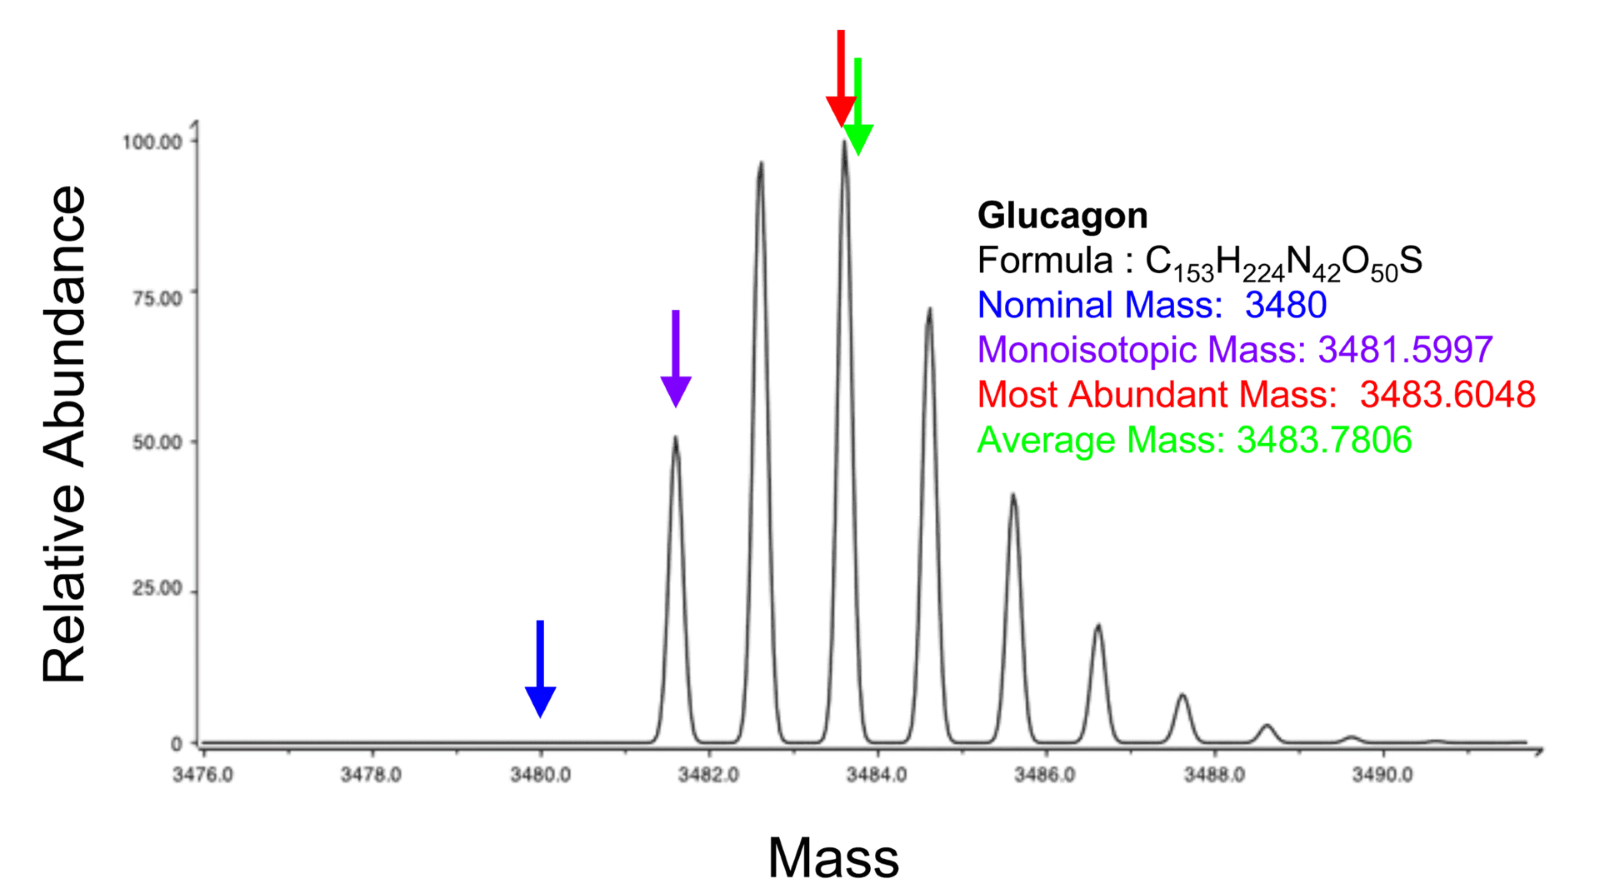
- One molecule shows expression at multiple m/z values due to adduct formation and isotopical peaks. Isotopes are atom species of the same chemical element that have different masses, caused by a different number of neutrons. Examples include 1H and 2H or 12C and 13C. A single molecule with a given elemental formula will therefore give rise to an isotopic distribution, i.e., a set of peaks at different m/z values, the location and intensity distribution of which are determined by its constituent atoms.
Ion enhancement and ion suppression
Finally, it is important to be aware of ion enhancement and ion suppression. Recall that the intensity measured for a specific mass-to-charge ratio is a measure for the relative abundance of that m/z value in detected ions. The problem is that not all ions are formed equally in the source of the mass spectrometer. This is caused by the fact that some analytes have higher ionization efficiency in the source, which means that they are more eager to receive a charge compared other molecules. Since the detector only detects ions, analytes with a higher ionization efficiency will have a disproportionately high intensity (enhancement) in the mass spectrum as compared to analytes with lower ionization efficiency which will be suppressed.
As such, due to ion suppression/enhancement, intensities in a mass spectrum do not allow direct assessment of abundance of the different analytes in the sample. In non-imaging MS, various ways exist to significantly reduce the impact of ion suppression/enhancement, but unfortunately most of those measures cannot be used in MS imaging.
Conclusion
This post contained a birds-eye view of the wonderful world of mass spectrometry. We’ve provided a basic overview of the technology’s key components and what the resulting data looks like.
If you have any questions or suggestions related to the content of this post, please do not hesitate to contact us!
This post is part of our series titled "Mass spectrometry data introduction", which contains the following entries:
Introduction to mass spectrometry data analysis (current post)