

Introduction to spatial multi omics data analysis – sample co-registration
Accurate co-registration is the first, and perhaps most important, step in spatial multi-omics data analysis.
Access publication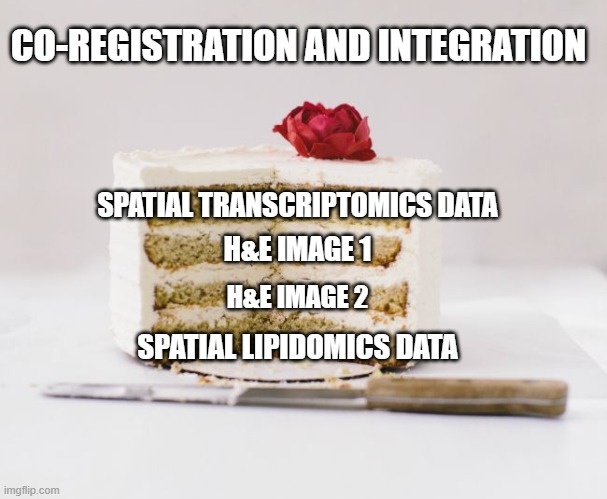
Introduction
So you’ve measured your samples with different spatial omics modalities – time to interpret them! But how to tell if those transcripts are associated with that cell cluster that you measured with immunofluorescence? Aligning different spatial datasets, commonly known in the field as “co-registration”, is necessary to relate the findings obtained through different modalities with each other and any combined downstream analysis. But this is not a trivial task – imagine that you had a cake, cut it into layers and then stack those layers back in their original positions. This entry will talk about why accurate co-registration is necessary in spatial multi omics data analysis and different ways in which it has been approached.
Signal context matters!
Knowing where your signal comes from is extremely important given that many spatial omics studies are used to examine diseases where tissue organisation is disturbed. For example, studies using MALDI imaging-built classifiers of cancer samples have found that classification accuracy is negatively affected by including signal not related to disease.1,2 Put simply, while spatial omics studies use molecular methods to gather deeper insights than can be gleaned from histopathology alone, the presence of a reference histopathology slide, with an H&E section or an appropriate cell marker label or nuclear counterstains, is necessary to identify where your signals come from.
This applies not only to methods with relatively low spatial resolution, such as spatial transcriptomics on the Visium platform or MALDI imaging, but also to contextualise the location of signals in high spatial resolution methods such as multiplexed immunofluorescence. For example, imagine for a moment that someone handed you the following, which is a real immunofluorescence image taken at 40x magnification on a confocal microscope:
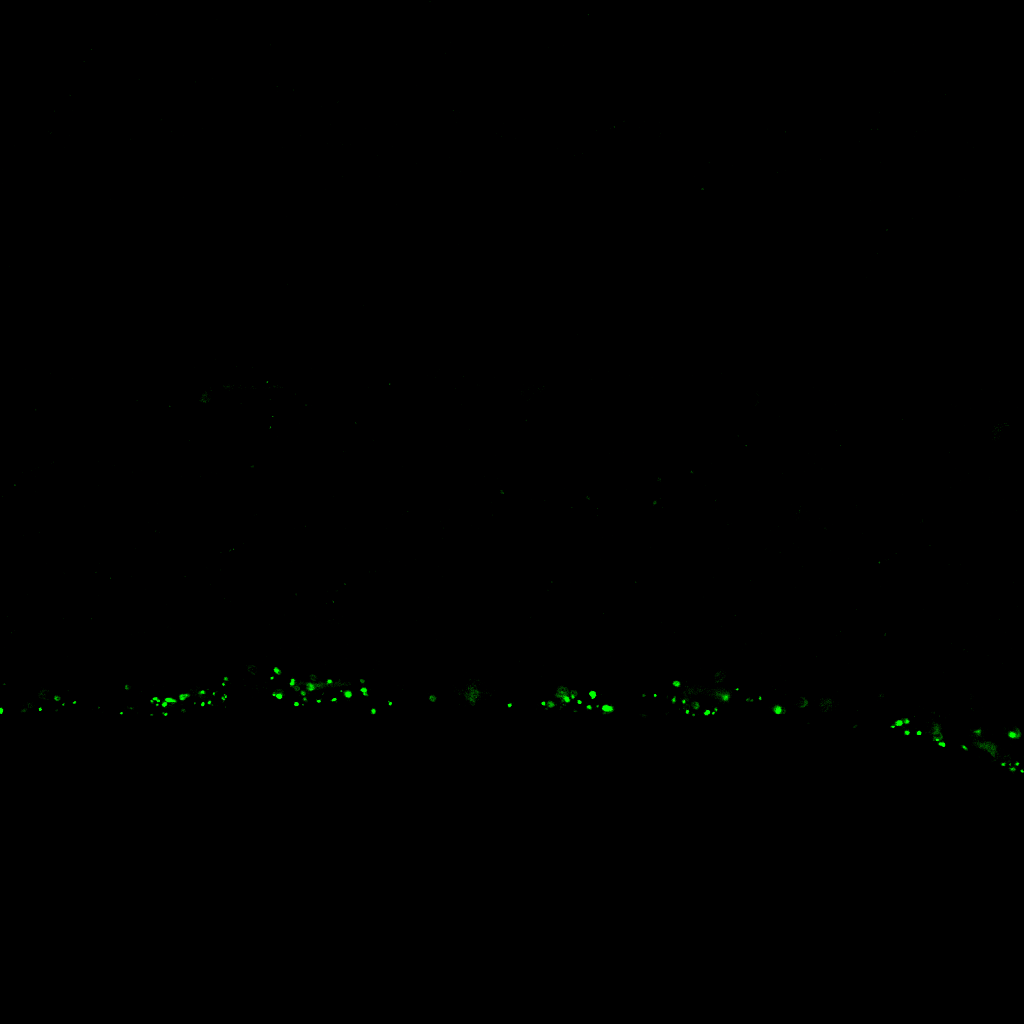
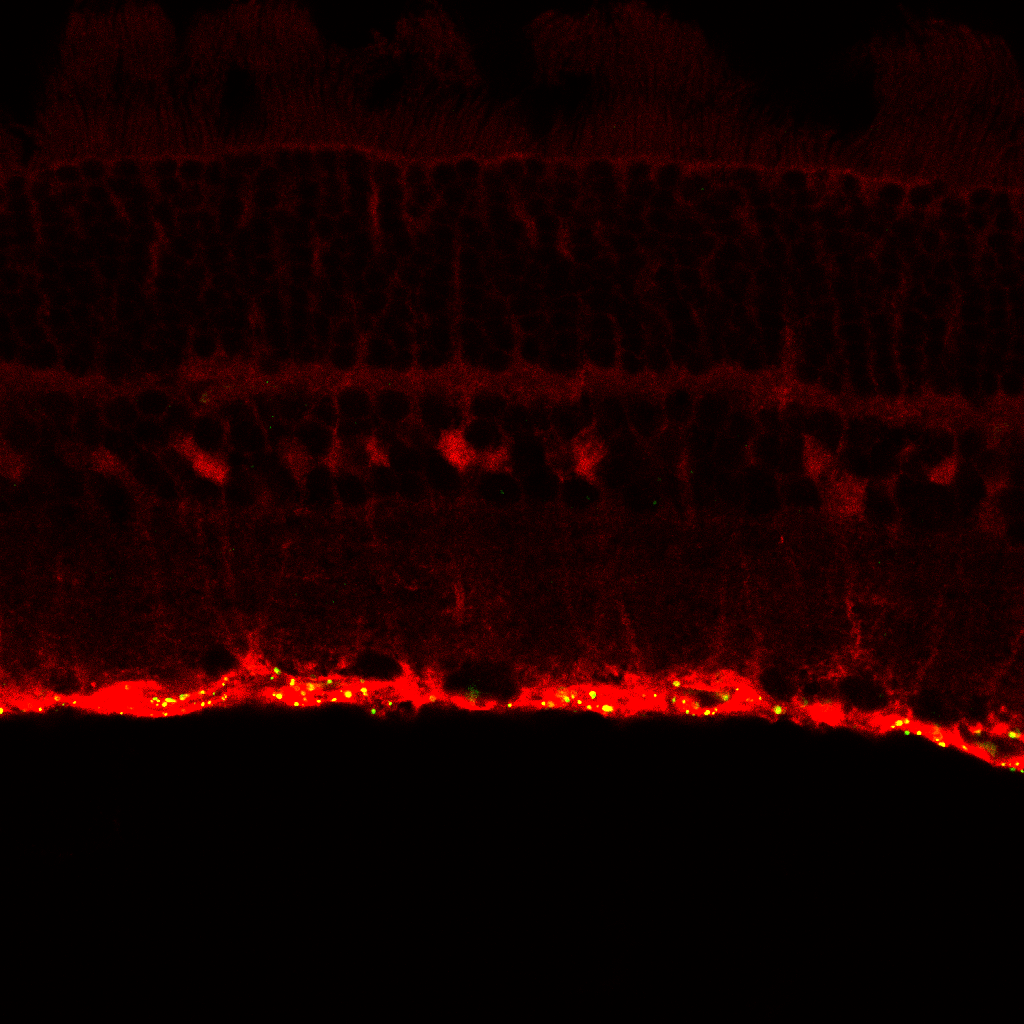
Even if you were the one who did the experiment, could you confidently know where in the tissue the signal was coming from? Now with a cell marker, it is possible to see that the green signal locates to the endfeet of Müller cells in the Inner Limiting Membrane of the retina.
Challenges in spatial multi omics data co-registration
However, making sure you can associate your signals isn’t always as easy as adding a cell marker to your experiments. Some co-registration challenges that users face include:
- Using different sections
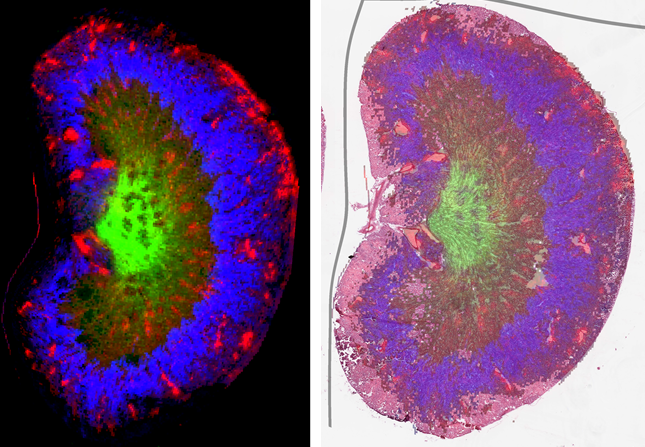
- Some spatial biology techniques cannot be conducted on the same section, usually due to having specific steps or requirements that make it incompatible with other platforms. Co-registration therefore needs to take into consideration differences in the sections, even when they are neighbouring sections. The image below shows a MALDI imaging dataset on the left, while on the right is that same dataset co-registered to the serial H&E-stained sections. The grey line is the border of the original MALDI imaging dataset, with the curvature showing how much transformation was required for accurate co-registration:
- Changes or damage to sections over multiple rounds of experiments
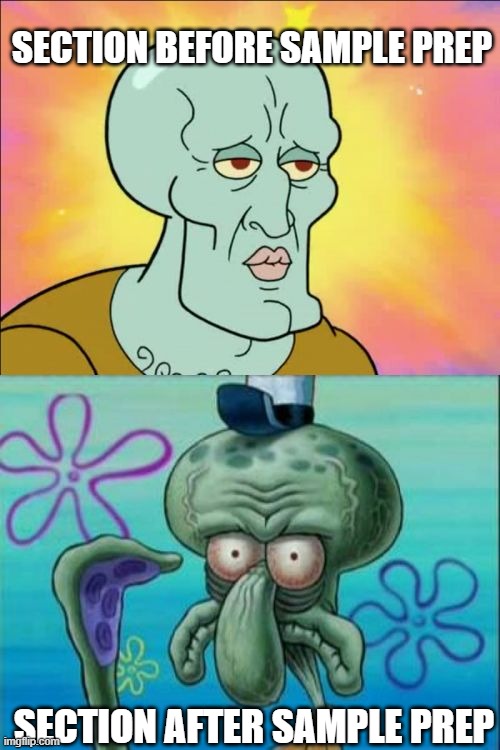
- While not always the case, this can happen for methods that can be conducted on the same section or those that require cycles to achieve multiplexing. For example, steps requiring agitation of slides in buffers could lead to lifting of sections if they have not fully adhered to the slides.
- Variation in acquisition sizes between modalities
- This can be not just the spatial resolution of the methods involved, e.g. Visium has 55 µm capture spots vs Xenium in the nanometre scale, but also whether the platforms involved can capture a whole section or specific regions. For example, some multiplexed immunofluorescence can image only a subset of a microscopy slide.
- Even platforms that use similar technologies can result in different spatial resolutions and acquisition areas. For example, whole slide imagers can differ a lot depending on the optics used and software control of what image acquisition.
Common co-registration strategies
Here are some different co-registration strategies and examples that can be found in the spatial multi omics space.
- Static landmarks
- Typically a marking on the slide itself and not the tissue and created in a way that is minimally affected by sample prep and data acquisition
- Commercial examples include IntelliSlides for MALDI Imaging and Visium slides fiducials
- 10X’s Visium slides have a fiducial spot pattern around their capture regions – this pattern is used in the 10X software to align the pre-preparation histology image with the individual barcoded spots.
- The fiducials on the Bruker IntelliSlides are glass etchings that are used to align the slide and sample to instrument optics, and the resulting dataset to other modalities.
- Landmark co-registration
- This matches features in the samples itself rather than the slide and can be used to account for section movement during the experiments.
- Landmarks can be both physical features in the sample, e.g. nuclei, blood vessels or tears, or artifacts that are induced by the sample preparation or measurement. For example, co-registering MSI data to the physical location of the laser or ion beam ablation marks. This may require taking a photo of the sample after measurement but before any other downstream sample use. One clever study used autofluorescence microscopy images of sections taken before sample preparation for later co-registration of multiple spatial omics modalities.3
Co-registration by Aspect Analytics
The co-registration tool in our Weave® software uses a non-rigid algorithm to align and create a common co-ordinate system between different spatial biology datasets. Our co-registration tool uses as many fiducials as needed to align datasets to your satisfaction, and can account for local deformations that can occur during sample preparation.
Unlike other available tools, co-registration in Weave can be performed automatically or manually, and on data acquired from same or serial sections, and even reference atlases. The below figure shows co-registration accuracy when using data acquired from the same section, with perfect alignment of DAPI-stained nuclei in a fluorescence image to its respective hematoxylin-stained nuclei from brightfield H&E image.

Here is an example where Weave’s co-registration approach is used to integrate newly acquired data with a known reference atlas. In this video, the user co-registered experimental spatial lipidomics data to the Allen Institute’s Mouse Brain Atlas, allowing them to investigate which lipids are distributed in specific anatomical regions.
Summary
In this post, we discussed the need for image co-registration in spatial multi omics studies, some challenges and strategies that exist in the field, and demonstrated Weave’s co-registration tool. If you are interested in our software, feel free to contact Aspect Analytics for more information.
References:
- Gonçalves JPL, et. al, The Impact of Histological Annotations for Accurate Tissue Classification Using Mass Spectrometry Imaging. Metabolites. 2021 https://doi.org/10.3390/metabo11110752
- Deininger SO, et al. Multicenter Evaluation of Tissue Classification by Matrix-Assisted Laser Desorption/Ionization Mass Spectrometry Imaging. Anal Chem. 2022 https://doi.org/10.1021/acs.analchem.2c00097
- Patterson NH, et al, Next Generation Histology-Directed Imaging Mass Spectrometry Driven by Autofluorescence Microscopy. Anal Chem. 2018
https://doi.org/10.1021/acs.analchem.8b02885

